This variance calculator can quickly calculate the variance of any dataset, whether it is a population or a sample dataset. Furthermore, it computes the mean and standard deviation of the entered dataset.
<iframe src="https://calculatorhub.org/?cff-form=100" style="width:100%;height:100%;"></iframe>
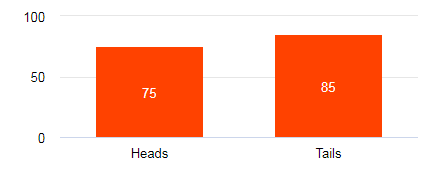
The average squared distance between the data set’s mean and each data value is the variance of a data set. The below graph displays the outcomes of 100 fair coin tosses, which produced 75 heads and 85 tails.
The results have a mean value of 80. The squared distance between the heads value and the mean is (75 – 80)2 = 25, and the squared distance between the tails value and the mean is (85 – 80)2 = 25.
The variance, which is 25 when these two squared distances are averaged, is obtained using the below variance formula.
Variance Calculator Use
- It’s really easy to use this variance calculator.
- Choose the dataset type first: sample or population.
- The dataset values should then be entered, separated by commas.
- When the calculator receives the dataset values, it will calculate the count, mean, standard deviation, and variance for the given dataset.
Variance Formula
The formulas to calculate the variance for a sample dataset and a population dataset are different. Both the formulas to calculate the variance are mentioned below.
Sample variance formula:

s = variance
x̄ = mean
xi = individual terms in dataset
N = total dataset terms
Population variance formula:

σ = variance
μ = mean
xi = individual terms in dataset
N = total dataset terms
How to Find the Variance (step by step)
You might think it’s challenging to calculate the variance after looking at the variance formula. However, things that appear tough at first glance rarely are. We’ll make sure that you can calculate the population variance and sample variance in just a few simple steps.
Two examples of population and sample variation are discussed in detail below. We have made an effort to make the steps as simple as we can.
Example (population variance)
1. Given the following population data, find its population variance.
| X | 45 | 28 | 11 | 16 | 54 | 33 | 49 |
Solution :
From the given population data we have to find out the mean (μ), total dataset value (N), so that we can use these values in the population variance formula to calculate the variance.
First we will find the value of mean (μ) using the below formula:

sum of data values = 45+28+11+16+54+33+49 = 236
total number of data values = 7
Mean (μ) = 236/7 = 33.7143
Total Dataset Value (N) = 7
Xi = individual dataset values
Using population variance formula,
σ2 = ∑(xi – μ)2 / N
σ2 = ∑ [ (45-33.7143)2 +(28-33.7143)2 +(11-33.7143)2 +(16-33.7143)2 +(54-33.7143)2 +(33-33.7143)2 +(49-33.7143)2 ] / 7
σ2 = ∑ [ (11.2857)2 +(-5.7143)2 +(-22.7143)2 +(-17.7143)2 +(20.2857)2 +(-0.7143)2 +(15.2857)2 ] / 7
σ2 = ∑ [ 127.4+32.65+515.94+313.8+411.51+0.51+233.653 ] / 7
σ2 = 1635.463 / 7
σ2 = 233.6
The population variance of the given dataset is 233.6
Example (sample variance)
2. Find the sample variance of the data (8, 15, 22, 31, 46, 50, 65, 79).
Solution:
In this example we have to find the variance using the sample variance formula.
Mean (x̄) = sum of dataset / total number of dataset
Mean (x̄) = (8+15+22+31+46+50+65+79) / 8
Mean (x̄) = 316/8
Mean (x̄) = 39.5
Mean (x̄) = 39.5
Total Dataset Value (N) = 8
Xi = individual dataset values
Using sample variance formula,
s2 = ∑(xi – x̄)2 / N – 1
s2 = ∑(8 – 39.5)2 + (15 – 39.5)2 + (22 – 39.5)2 + (31 – 39.5)2 + (46 – 39.5)2 + (50 – 39.5)2 + (65 – 39.5)2 + (79 – 39.5)2/ 8 – 1
s2 = ∑ [ 992.25+600.25+306.25+72.25+42.25+110.25+650.25+1560.25 ] / 7
s2 = 4334 / 7
s2 = 619.143
The sample variance of the given dataset is 619.143
How Do You Find Standard Deviation?
If you’ve been paying attention to the calculator up above, you’ve probably noticed that in addition to showing the variance, it also shows the standard deviation from the input datasets. In layman’s terms, standard deviation is the square root of variance.
The most widely used indicator of statistical dispersion in statistics is the standard deviation. The standard deviation calculates how dispersed a data set’s values are.
You may simply square root the variance value to determine the standard deviation value. To perform this calculation, try our square root calculator.
For example, if the value of variance is 245.26, then the standard deviation value will be 15.66077904 (square root of 245.26).